lsq_examples.m --- Linear Least Squares examples.
Contents
Close all existing plots
close all
Defaults for plotting
set(0,'defaultlinelinewidth',2)
set(0,'defaultaxesfontsize',16)
set(0,'defaultaxesfontweight','bold')
Data points
x = [1.0 1.1 1.3 1.5 1.9 2.1]';
y = [1.84 1.90 2.31 2.65 2.74 3.18]';
Evaluation points
xv = 1.0:0.01:2.1;
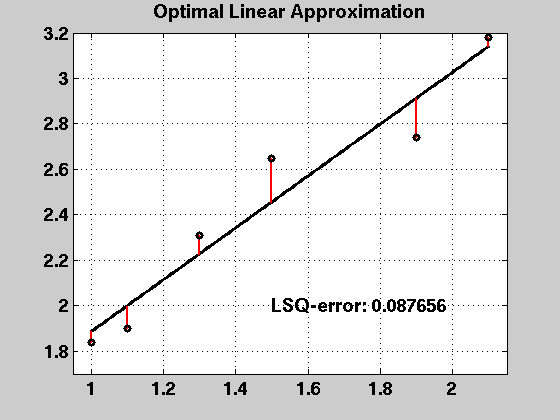
Linear model
A1 = [ones(size(x)) x];
pcoef1 = A1\y;
p1 = polyval(flipud(pcoef1),xv);
y1 = polyval(flipud(pcoef1),x);
p1err = y1 - y;
figure
plot(xv,p1,'k-','linewidth',3); hold on;
for k=1:length(x)
plot([x(k) x(k)],[y(k) y1(k)],'r-')
end
plot(x,y,'ko','linewidth',3); hold off
title('Optimal Linear Approximation')
axis([0.95 2.15 1.7 3.2]); grid on
text(1.5,2,sprintf('LSQ-error: %f',norm(p1err)^2), ...
'FontWeight','Bold','FontSize',14)
fprintf('LSQ-error (squared): %f\n',sum(p1err.*p1err));
fprintf('cond(A1) : %f\n',cond(A1));
fprintf('cond(A1''*A1) : %f\n',cond(A1'*A1));
LSQ-error (squared): 0.087656
cond(A1)           : 8.246665
cond(A1'*A1)       : 68.007482
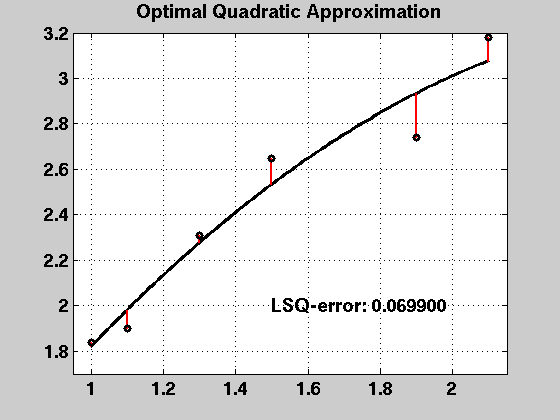
Quadratic model
A2 = [A1 x.*x];
pcoef2 = A2\y;
p2 = polyval(flipud(pcoef2),xv);
y2 = polyval(flipud(pcoef2),x);
p2err = y2 - y;
figure
plot(xv,p2,'k-','linewidth',3); hold on;
for k=1:length(x)
plot([x(k) x(k)],[y(k) y2(k)],'r-')
end
plot(x,y,'ko','linewidth',3); hold off
title('Optimal Quadratic Approximation')
axis([0.95 2.15 1.7 3.2]); grid on
text(1.5,2,sprintf('LSQ-error: %f',norm(p2err)^2), ...
'FontWeight','Bold','FontSize',14)
fprintf('LSQ-error (squared): %f\n',sum(p2err.*p2err));
fprintf('cond(A2) : %f\n',cond(A2));
fprintf('cond(A2''*A2) : %f\n',cond(A2'*A2));
LSQ-error (squared): 0.069900
cond(A2)           : 111.908225
cond(A2'*A2)       : 12523.450801
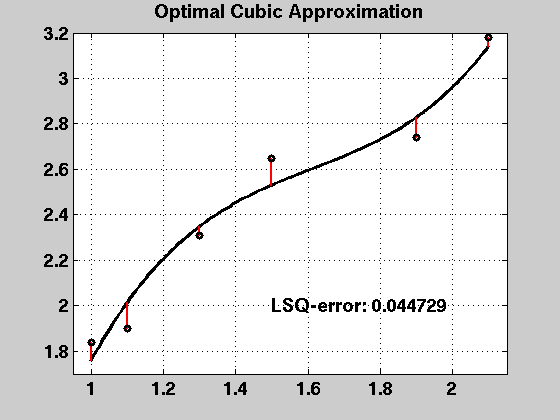
Cubic model
A3 = [A2 x.*x.*x ];
pcoef3 = A3\y;
p3 = polyval(flipud(pcoef3),xv);
y3 = polyval(flipud(pcoef3),x);
p3err = y3 - y;
figure
plot(xv,p3,'k-','linewidth',3); hold on;
for k=1:length(x)
plot([x(k) x(k)],[y(k) y3(k)],'r-')
end
plot(x,y,'ko','linewidth',3); hold off
title('Optimal Cubic Approximation')
axis([0.95 2.15 1.7 3.2]); grid on
text(1.5,2,sprintf('LSQ-error: %f',norm(p3err)^2), ...
'FontWeight','Bold','FontSize',14)
fprintf('LSQ-error (squared): %f\n',sum(p3err.*p3err));
fprintf('cond(A3) : %f\n',cond(A3));
fprintf('cond(A3''*A3) : %f\n',cond(A3'*A3));
LSQ-error (squared): 0.044729
cond(A3)           : 1670.659656
cond(A3'*A3)       : 2791103.686034
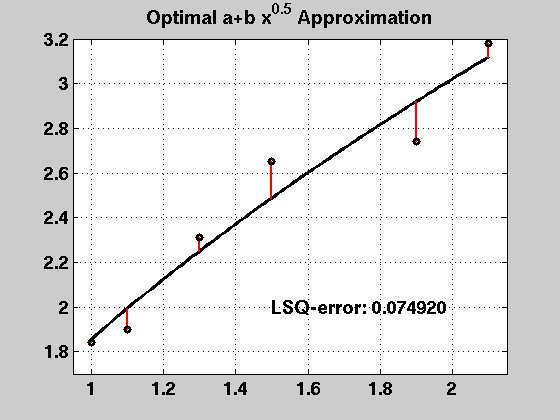
"Interesting" square-root model
A4 = [ones(size(x)) sqrt(x)];
pcoef4 = A4\y;
f4 = pcoef4(1) + pcoef4(2)*sqrt(xv);
y4 = pcoef4(1) + pcoef4(2)*sqrt(x);
p4err = y4 - y;
figure
plot(xv,f4,'k-','linewidth',3); hold on;
for k=1:length(x)
plot([x(k) x(k)],[y(k) y4(k)],'r-')
end
plot(x,y,'ko','linewidth',3); hold off
title('Optimal a+b x^{0.5} Approximation')
axis([0.95 2.15 1.7 3.2]); grid on
text(1.5,2,sprintf('LSQ-error: %f',norm(p4err)^2), ...
'FontWeight','Bold','FontSize',14)
fprintf('LSQ-error (squared): %f\n',sum(p4err.*p4err));
fprintf('cond(A4) : %f\n',cond(A4));
fprintf('cond(A4''*A4) : %f\n',cond(A4'*A4));
LSQ-error (squared): 0.074920
cond(A4)           : 15.109607
cond(A4'*A4)       : 228.300213
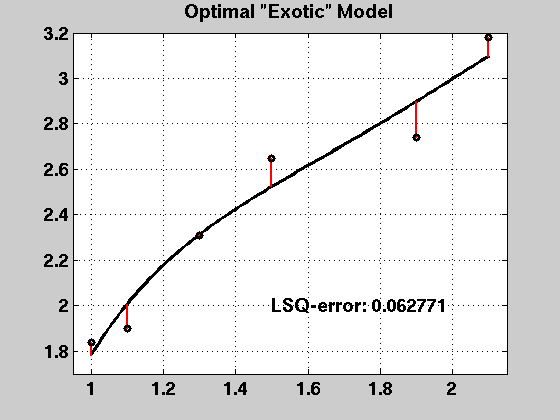
Exotic model
A5 = [ones(size(x)) x.^(3/2) 1./sqrt(x) exp(sin(x))];
pcoef5 = A5\y;
f5 = pcoef5(1) + pcoef5(2)*xv.^(3/2) + pcoef5(3)./sqrt(xv) + ...
pcoef5(4)*exp(sin(xv));
y5 = pcoef5(1) + pcoef5(2)*x.^(3/2) + pcoef5(3)./sqrt(x) + ...
pcoef5(4)*exp(sin(x));
p5err = y5 - y;
figure
plot(xv,f5,'k-','linewidth',3); hold on;
for k=1:length(x)
plot([x(k) x(k)],[y(k) y5(k)],'r-')
end
plot(x,y,'ko','linewidth',3); hold off
axis([0.95 2.15 1.7 3.2]); grid on
title('Optimal "Exotic" Model')
text(1.5,2,sprintf('LSQ-error: %f',norm(p5err)^2), ...
'FontWeight','Bold','FontSize',14)
fprintf('LSQ-error (squared): %f\n',sum(p5err.*p5err));
fprintf('cond(A5) : %f\n',cond(A5));
fprintf('cond(A5''*A5) : %f\n',cond(A5'*A5));
LSQ-error (squared): 0.062771
cond(A5)           : 2208.908987
cond(A5'*A5)       : 4879278.912967